Reports and CSV export
The Reports tab has three views behind the buttons at the top: Daily, Weekly / Monthly and Fleet Snapshot. Daily is the morning glance, Weekly / Monthly is where the money is, Fleet Snapshot is the thing you print and pin up.
Daily
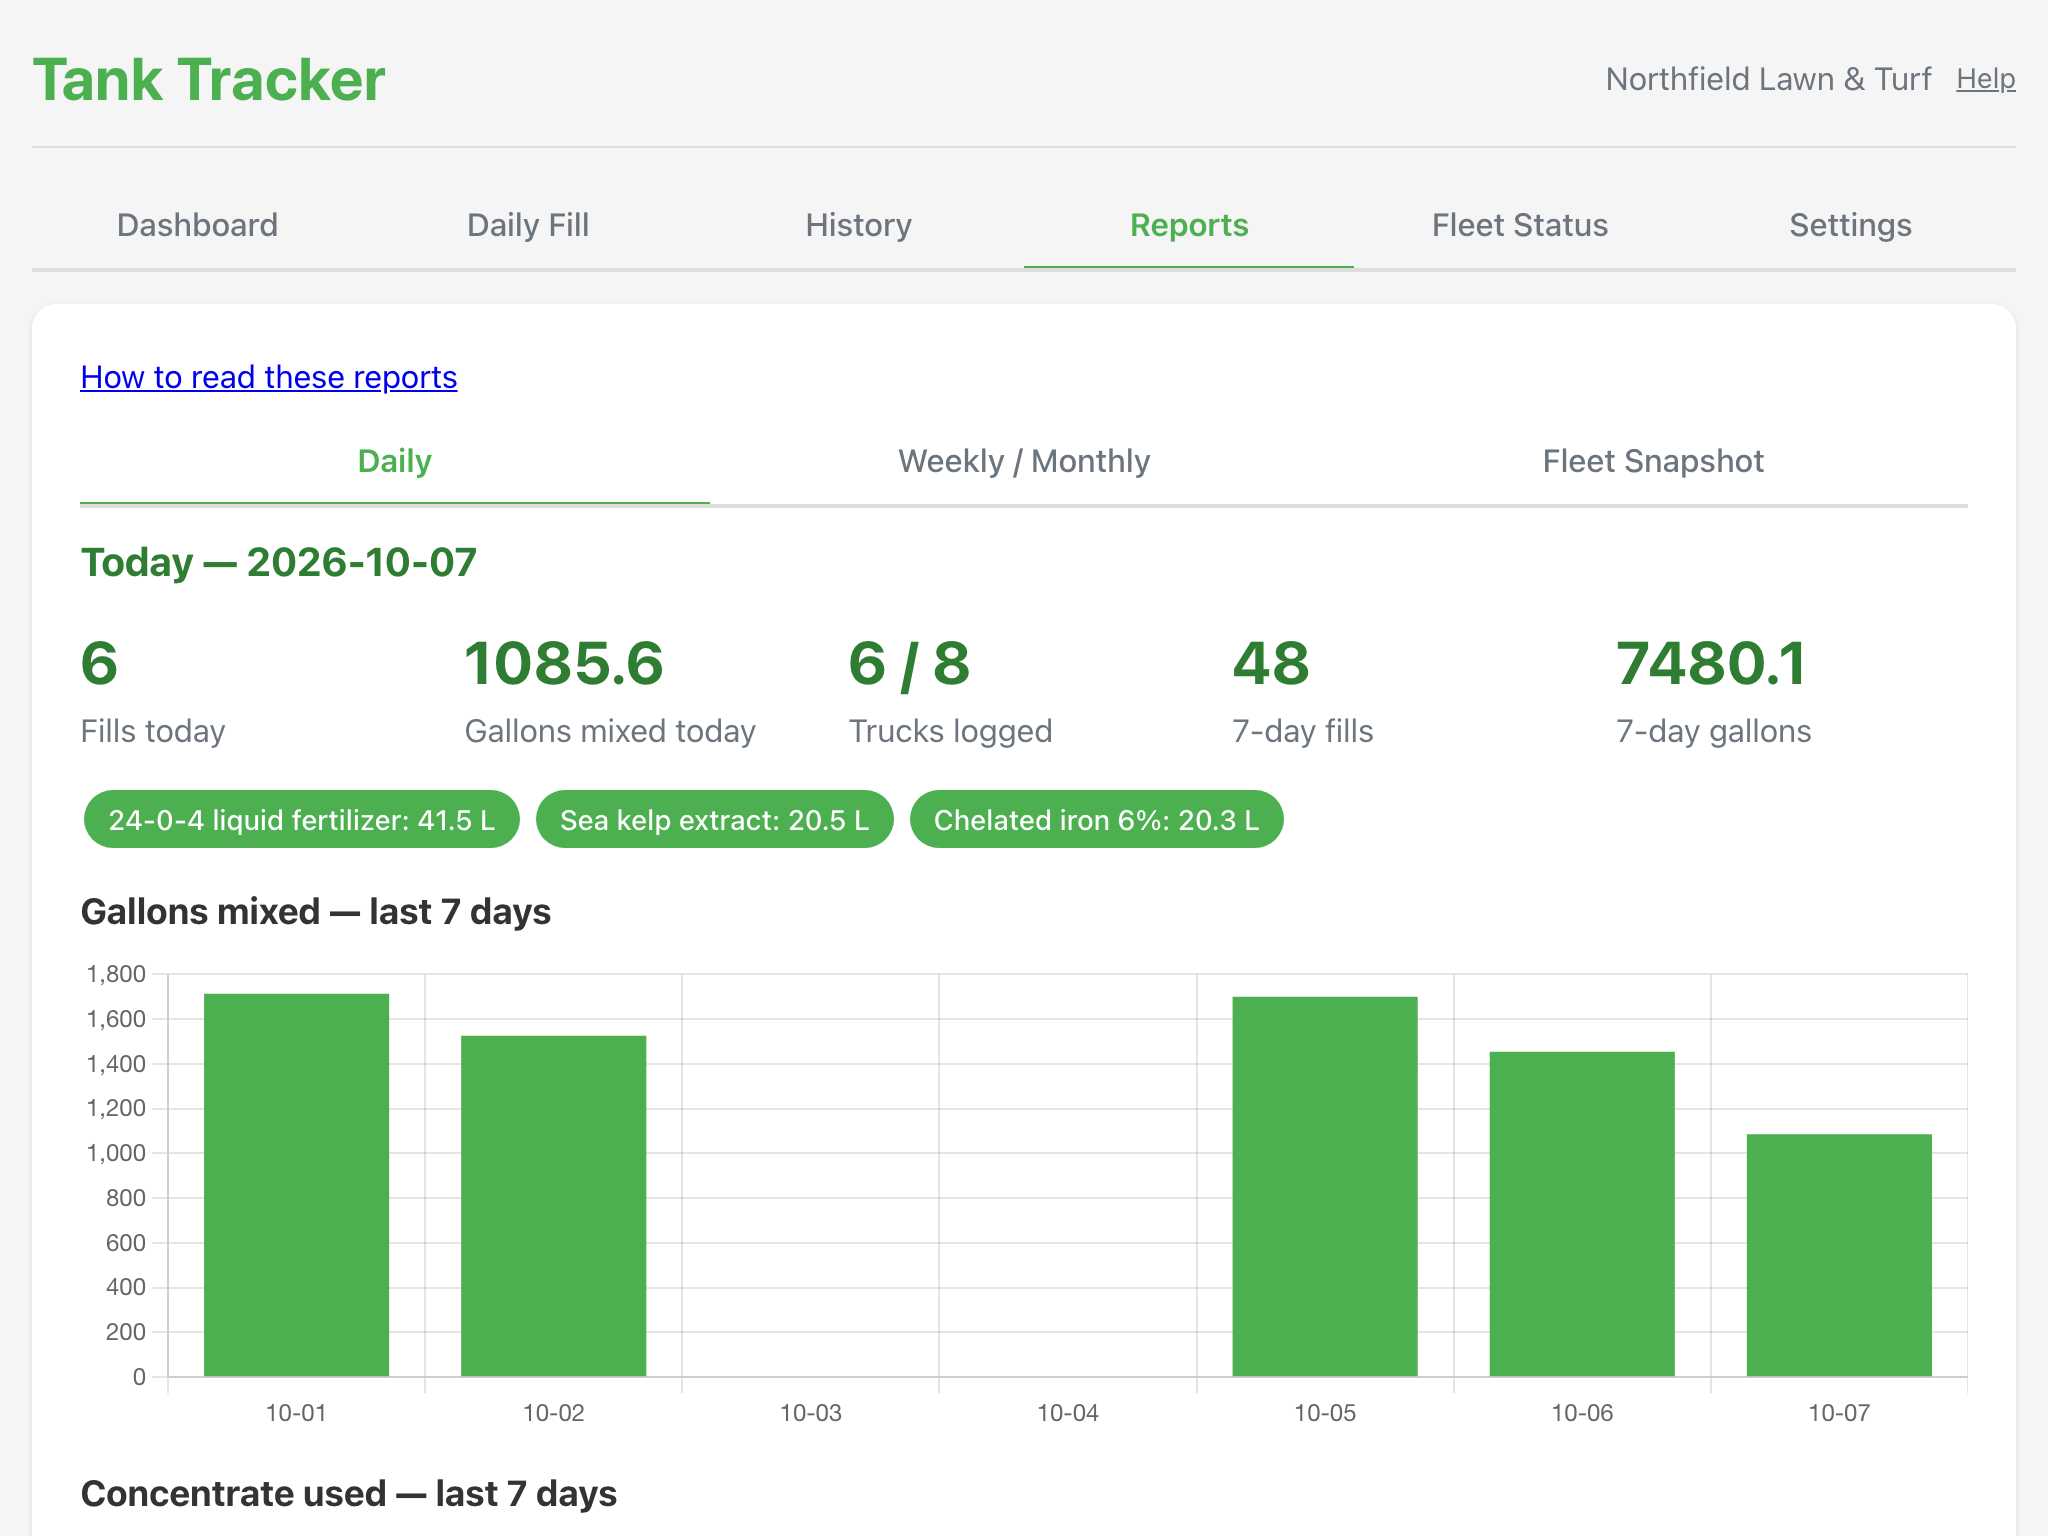
Five tiles across the top for today and the week behind it: fills today, gallons mixed today, how many of your trucks have been logged, then fills and gallons over seven days. Underneath, two charts: gallons mixed per day for the last seven days, and concentrate used per product over the same week.
The one to watch is trucks logged, shown as a fraction of your active fleet. If it reads 17 of 20 at the end of a spray day, three trucks went out without a record, and you want to know that today rather than in November.
The application-rate audit
Below the charts, the daily view flags trucks whose applied volume since their last fill falls outside their own rolling average by more than a set percentage. It is comparing a truck with itself, not with the rest of the fleet, so a big truck on big properties is not permanently flagged.
The threshold and the window are yours to set, in Settings, in App Info, under Outlier detection. The window defaults to 30 days, and you can widen it if your work is seasonal and lumpy. The threshold field defaults to 25 percent, but any value below 50 percent is treated as 50: a fill is only flagged once its tank has at least three earlier readings in the window, and then only if the applied amount is more than half again above or below the rolling average from those readings.
A flag is a prompt to ask a question, not a verdict. The usual causes are a misread dipstick, a fill that was never logged, or a genuinely unusual day.
Weekly / Monthly
Pick a preset, This Week, Last Week, This Month, Last Month or Year to Date, or set the two dates yourself and the preset becomes Custom. Everything below redraws for that range.
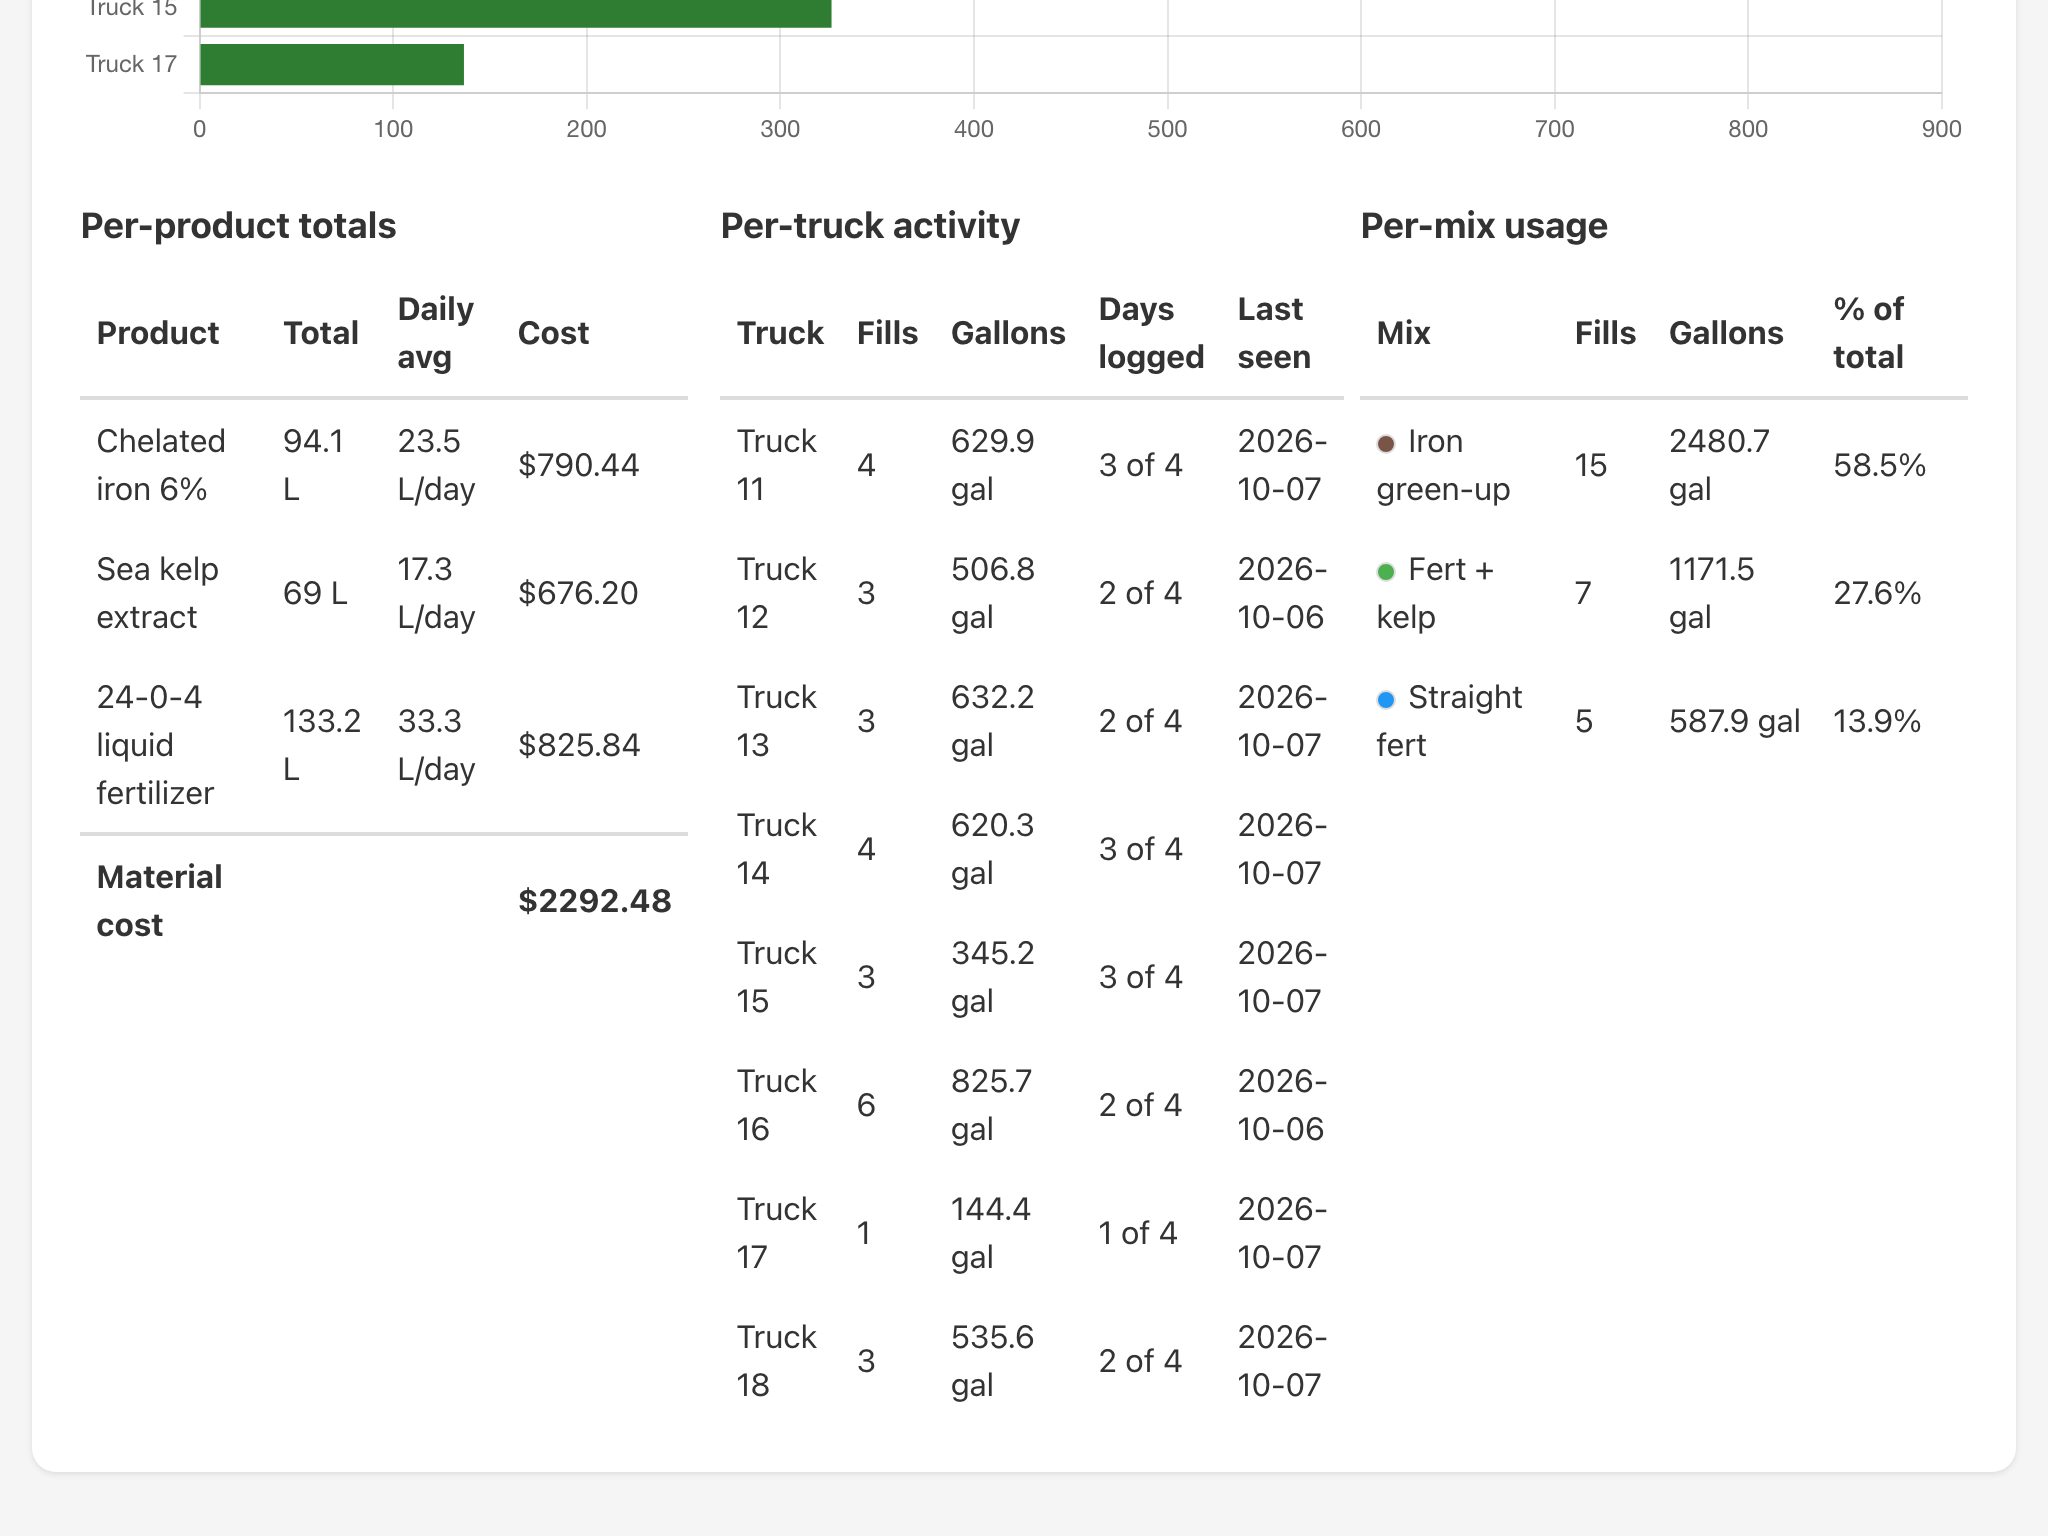
Three tables carry the answers:
- Per-product totals. How much of each concentrate went out, a daily average, and the cost, where the product has a cost per unit.
- Per-truck activity. Fills, gallons, days logged and when the truck was last seen. Days logged against the number of spray days in the range tells you how consistently each truck is actually being logged.
- Per-mix usage. Fills, gallons and the share of the range's total, so you can see what your season is actually made of.
Every cost here was captured on the fill it belongs to, at the price in force that day. Putting the price up in July does not change what June cost.
Fleet Snapshot
One card per truck showing each tank's current level against its capacity, the mix in it, and when it was last touched. Trucks that have not checked in today are called out at the top. Print fleet snapshot gives you a clean sheet stamped with the time it was printed and the name of whoever printed it. That sheet on the shop wall at seven in the morning answers most of the questions the dock is about to ask.
Getting the numbers out
Three CSV files, from History (which exports what your current filters show) or from Settings, in Data Export & Backup (which exports everything):
- Fills CSV. One row per tank fill. It begins
date,timestamp,truck,tank,dipstick_gal,gallons_filled,gallons_after,mix_name,omitted_products, then up to six product blocks, each giving the product's name, its rate, its unit, the amount used, the cost per unit and the cost, thenmaterial_cost_total,recorded_by,tech_name,notes,voided,void_reason. - Tank reports CSV. One row per dipstick reading, including the readings that did not turn into a fill:
date,timestamp,truck,tank,dipstick_gal,mix_id,mix_name,resulted_in_fill,fill_id,recorded_by,notes,voided. - Daily summary CSV. One row per day:
date,fills_count,total_gallons_mixed,trucks_active, then one total column per product.
The files open in Excel, Numbers and Google Sheets with no fuss, and they are the right thing to hand an accountant or an agronomist. Voided records carry voided and their reason, so a spreadsheet can filter them out and still see that they existed.
A full backup
In the same card, Download backup (JSON) takes the whole local copy, and Restore from backup puts one back. The restore replaces everything on that device, so it asks you to type a word before it does anything. Your workspace on the server is backed up separately; this is for your own peace of mind.
What the application record gives you
Because every fill carries the truck, the tank, the date and time, the person who recorded it, the mix, the amount of each product and what it cost, the pesticide application record keeps itself as a by-product of the daily routine. Nobody has to write it up at the end of the week, and when a customer rings about a lawn there is a record to look at.